Prior Topic ~ Line Graphs

What is a PIE CHART?

Using different colours for each fruit:
What is a pie?
Usually, a baked-dish in a round-shaped container

What is a PIE CHART?
Pie Chart: a special chart that uses
"pie slices" to show relative sizes of data.
Example:
In a basket, there
are 1 apples, 2 pears, 2 bananas and 3 oranges.
Fruit
|
Numbers
|
Apple
|
1
|
Pear
|
2
|
Orange
|
2
|
Banana
|
3
|
Total
|
10
|
There are
altogether 10 fruits => there are 10 portions in the pie.

Using different colours for each fruit:

Understanding the Pie Chart
The information in the table represented in the Pie Chart:
The information in the table represented in the Pie Chart:
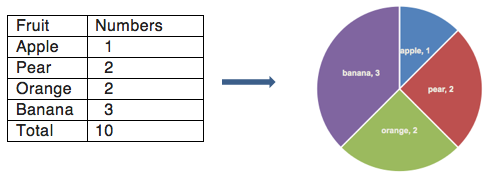
The Pie Chart shows that there are 3 bananas, 2 pears, 2 oranges and 1 apple.
RELATING PIE CHART TO FRACTION/PERCENTAGE/ANGLES
Pie Chart and Fraction
Example : What fraction of the fruits is bananas?
Method
Step1: Compute the total
value.
Total number of fruits = 10
Step2: Apply formula: Required value
Total value
Number of
Bananas = 3
Fraction = 3/10
Pie Chart and Percentage
Example: What is the percentage
of orange in the basket?
Method
Step1: Compute the total
value.
Total number of
fruits = 10
Step2: Required Percent = Required Value x 100
Total Value
Pie Chart to Angles
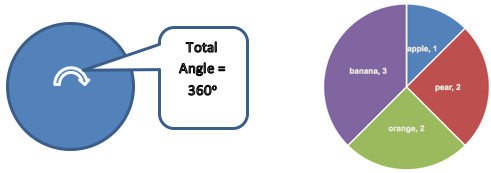
Total degree for a pie chart(circle) is 360o
Find an angle when given the value
Example: What is the angle
representation of apple?
Method
Step1: Compute total
value.
Step2: Apply Formula Compute
Angle :
= Required
Value x 360o
Total Value
Angle for Apple
= 1/10 x 360o = 36o
Example
The pie chart shows how a class of student
travel to school.

(a) What fraction
of the students go to school by bus?
Method
Step1: <Read,
underline keywords> Compute the total value
Total number of
student = 10+5+5+20 = 40
Step2: Apply formula: Required value
Total value
Fraction of
students go to school by bus = 5 / 40 = 1/8
(b) What percentage of
student go to school by MRT?
Method
Step1: <Read,
underline keywords> Compute the total value.
Total number of
student = 10+5+5+20 = 40
Step2: Required Percent = Required Value x 100
Total Value
Percentage of
students go to school by MRT = 10/40 x
100 = 25%
Example
The pie chart shows the favourite TV programs listed by a group of 60 students.

Find a value when given
the angle
(a) How many students like SciFi program?
Method
Step1: Read, underline
keywords. Write total degree = 360o, and total value = 60
Step2: Apply Formula : Required value = Angle x Total Value
360
SciFi = 90o
Number of students who like SciFi = 90/360 x 60 = 15 students
Number of students who like SciFi = 90/360 x 60 = 15 students
(b) 10 students like Horror, what is the angle representation?
Method
Step1: Write total
degree = 360o, and total value = 60
Step2: Apply Formula Compute
Angle :
= Required
Value x 360o
Total Value
Horror = 10
The angle
representation for horror = 10/60 x 360 = 60o
~~~~ END ~~~~ :)
~~~~ END ~~~~ :)
No comments:
Post a Comment
Note: only a member of this blog may post a comment.