(Part 1) TEACHING(10-15mins)
1. Reading and interpreting pie chart data
(Part2) PRACTICE (20-30mins)
For question 1 and 2.
A group of pupils was asked on their preference of the different types of CCA. The pie chart below represents their preference. (18/13/p2/f)
 1. What fraction of the pupils chose Clubs as their favourite type of CCA?
2. 75 pupils chose Uniformed Groups as their favourite type of CCA. How many pupils chose Dances as their favourite CCA?
1. What fraction of the pupils chose Clubs as their favourite type of CCA?
2. 75 pupils chose Uniformed Groups as their favourite type of CCA. How many pupils chose Dances as their favourite CCA?
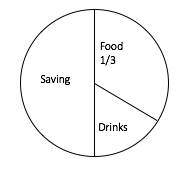
For Question 3 - 6.
The pie chart shows how Mavis
spends her weekly pocket money of $30.
3. What fraction of her pocket
money does she save?
4. What fraction of her pocket
money does she spend on drinks?
5. How much of her pocket money
does she spend on food?
6. How much of her pocket money
does she save?
For question 7-10.
The following pie chart shows
the types of fruits Jane sold on Sunday morning.
7. How many oranges did she sell?
8. What type of fruits did she
sell the most?
9. How many more apples than
oranges did she sell?
10. How many fruits did she sell altogether?
For question 11 – 13.
The pie chart shows the attendance at a running event.
 11.What percentage of the participants were adults and teenagers?
12.What percentage of the participants were children?
13.If there were 280 teenagers, how many adults were there?
11.What percentage of the participants were adults and teenagers?
12.What percentage of the participants were children?
13.If there were 280 teenagers, how many adults were there?
14. The pie chart represents the favourite animal of the pupils in Primary 6 Benevolence. There are as many fish as birds. How many pupils chose the terrapins as their favourite animal? (14/p1)

(1) 2
(2) 4
(3) 5
(4) 8 ( )
For question 15 – 16.
The pie chart shows the favourite sports of some children. (21/p1)

15. If 4/5 of the children who like soccer are boys, what fraction of the total number of children are boys who like soccer?
16.There are 15 boys who like soccer. How many children are there altogether?
For question 17 – 18.
The pie chart below shows the different types of biscuits sold at a supermarket.
 Half of the biscuits sold at the supermarket were butter cookies. The number of packets of wafer biscuits sold was 1/3 of the number of packets of butter cookies sold.
17.What fraction of the biscuits sold were oatmeal cookies?
18.1470 packets of butter cookies were sold. Find the total number of packets of wafer biscuits and oatmeal cookies sold. (18/p2/18/s)
Extra Practice
1.* The pie chart shows how John spent the money
he has. What fraction of the money did he spend on watch?
2. * The pie chart shows the favourite colours of
a group of children. What percentage of the children choose Blue as their favourite
colour?

3. The pie chart shows the attendance at a running event
(a) What percentage of the participants were adults and teenagers?
(b) What percentage of the participants were children?
(c) If there were 280 teenagers, how many adults were there?
Answer Keys
1. 3/25
2. 63
3. ½
4. 1/6
5. $10
6. $15
7. 15
8. Apples
9. 3
10. 60
11. 83%
12. 17%
13. 384
14. 4
15. 3/5
16. 25
17. 1/6
18. 635